Course evaluation at RPTU Landau
Project DigiKompASS, RPTU Kaiserslautern-Landau, 2021–2025. My role: responsible for the course evaluation, from concept to regular operation.
Starting point
Every semester, around 600 courses are evaluated, with 6,000 to 8,000 responses. Before the redesign, lecturers registered their courses by email via an attached spreadsheet, every course received the same questionnaire, and registration alone took several working days per semester. During the pandemic, teaching formats became much more varied, and it was no longer clear whether the existing questionnaire still fit them.
What I did
Questionnaire. Based on a needs analysis among students, I extended the core questionnaire, which remains the comparison metric across departments, and added optional modules for different teaching formats. The modules are purely formative feedback and do not enter the comparison, so lecturers can adapt the survey without breaking comparability. I checked the factor structure and measurement invariance across disciplines.
Rollout. The new process was tested in stages and extended step by step until it covered all departments at the Landau campus, in agreement with the faculty committees and the data protection officer.
Automated registration. The campus management system offers no export of course data, so I wrote a web scraper in R that collects it. Scripts then create personalised registrations in LimeSurvey, with pre-filled fields, validation and automatic confirmations. Direct API access to LimeSurvey was not available, so the workflow was designed to need as little manual work in LimeSurvey as possible. Registration now takes a few hours per semester instead of several working days.
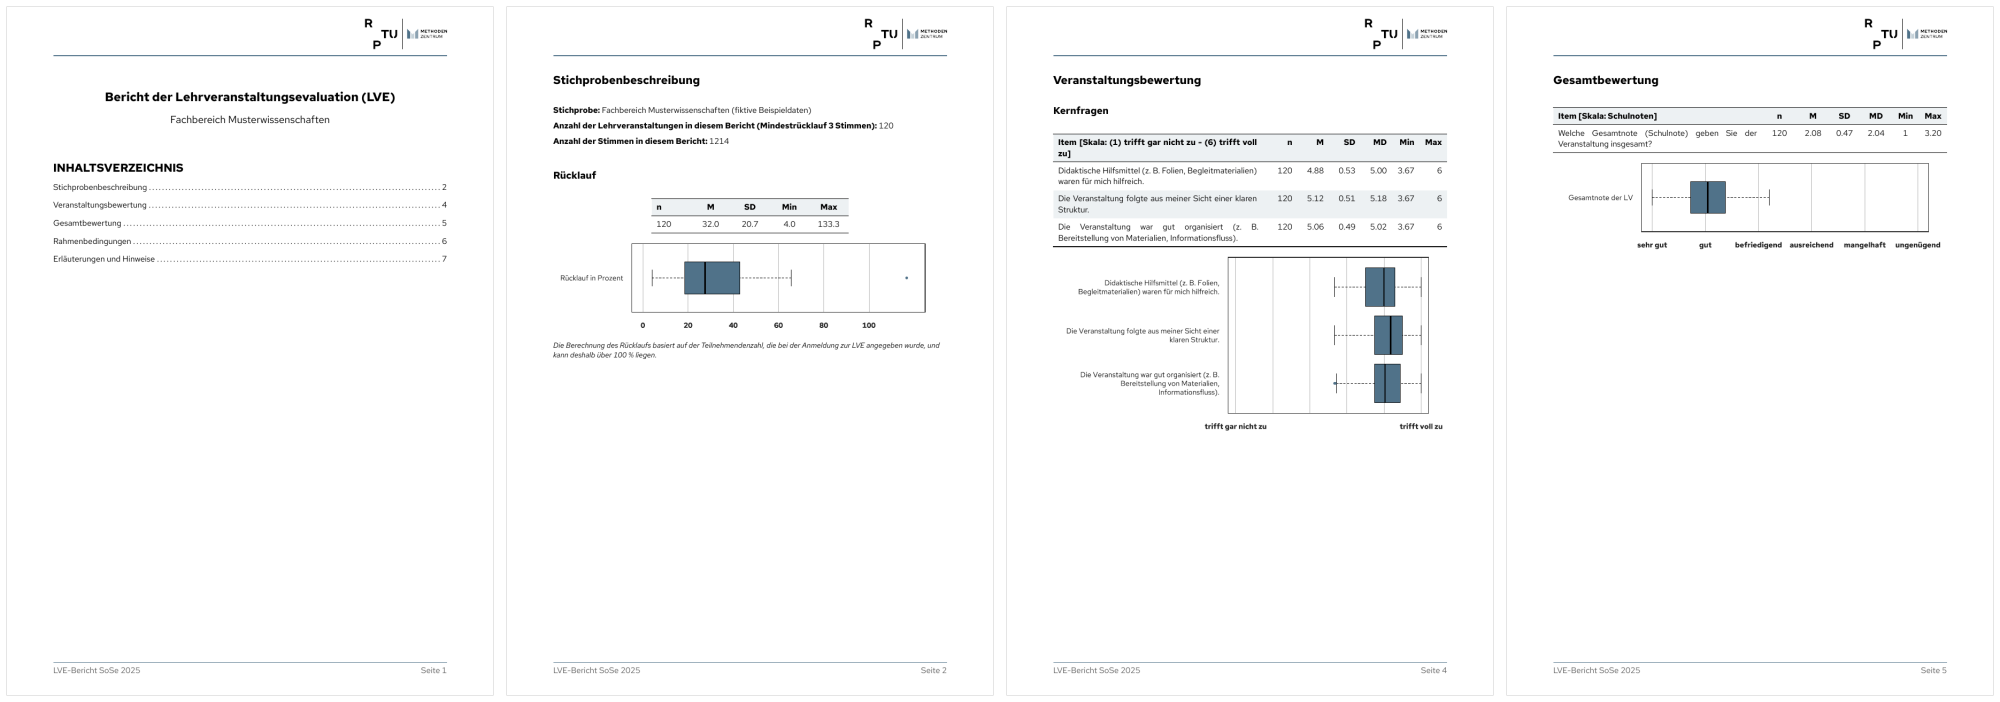
Reporting. I rebuilt the analysis and reporting pipeline as the R package setanalysis with Quarto templates: aggregated reports for faculties and, for cohort surveys, more than 100 tailored reports per round.
Open-ended responses. I guided the development of a pipeline that summarises open-ended answers with open-source language models (via Ollama), piloted it and validated it against two manual content analyses.
Result
The system is in regular operation and is now maintained by colleagues. The report examples below use fictitious data.